24 Feb Measuring What Matters: Estimating Hull Roughness During Routine Biofouling Inspections
When it comes to ship efficiency, size matters—specifically, the size of barnacles on your hull significantly impacts hull roughness. While most underwater inspections focus on identifying the presence of biofouling, understanding the actual dimensions of these organisms is critical for predicting their impact on fuel consumption and vessel performance.
Atlantic Tech & Candy, in partnership with Blue Atlas Robotics and their ROV Sentinus 2, has developed an approach to measure barnacle dimensions during routine biofouling inspections using stereo camera technology. This capability transforms standard inspection footage into quantitative data that operators can use for maintenance planning and performance monitoring.
Why Barnacle Size Matters More Than You Think
Not all biofouling has the same impact on drag. Research shows that barnacle height is the dominant factor in determining added resistance—far more than coverage area alone. A hull with 10% coverage of 5mm-tall barnacles can experience similar drag penalties as one with 50% coverage of smaller 1.25mm barnacles. This means that knowing how big your barnacles are, not just where they are, is essential for accurate performance predictions.
Hull roughness is typically characterized by parameters like equivalent sand-grain roughness (k_s), which directly influences drag calculations in performance models. By measuring barnacle dimensions, operators can estimate these roughness values and better understand the fuel penalty they’re facing.
From Inspection Video to Quantitative Hull Roughness Measurements
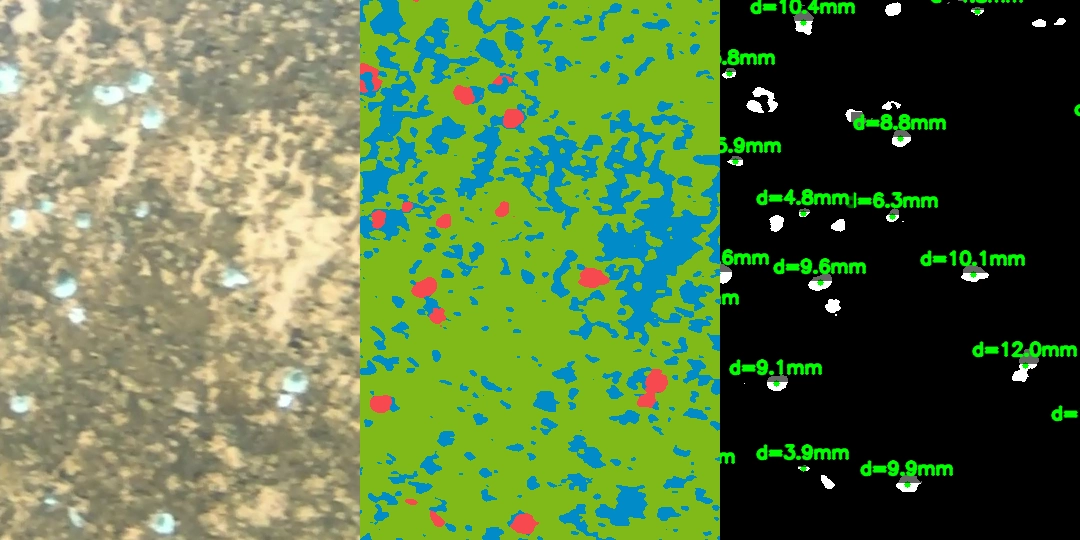
The stereo camera system on the Sentinus 2 ROV captures paired images that enable distance measurement to the hull surface. Combined with HullSight Ultimate, Atlantic Tech & Candy’s solution for biofouling analysis, this creates a complete pipeline from raw video to barnacle size estimates:
- Biofouling Detection: HullSight Ultimate’s semantic segmentation model identifies and segments barnacles (and other fouling types) in the inspection footage
- Distance Estimation: Stereo vision calculates the distance to the hull, typically 70-80cm during inspections
- Size Calculation: With known distance and camera parameters, pixel measurements convert to real-world dimensions
- Statistical Analysis: Individual barnacles are measured, including detection of barnacle clusters where multiple organisms have merged

For a typical inspection frame at 70cm distance, the system achieves approximately 0.5mm resolution—sufficient to characterize barnacles ranging from a few millimeters to several centimeters in diameter.
Handling Real-World Complexity
Barnacles don’t always grow as isolated individuals. Dense colonization often results in clusters where boundaries between organisms aren’t visible. The analysis approach accounts for this by using statistical methods to estimate the number of individual barnacles within merged clusters, providing more accurate population counts and size distributions.
In one analyzed frame, the system detected 180 distinct regions but estimated these represented approximately 462 individual barnacles—revealing that nearly one-third of the detected areas were actually clusters. This level of detail helps distinguish between light fouling with a few large barnacles and heavy colonization with many smaller organisms.
Practical Applications
This measurement capability integrates naturally into existing inspection workflows. The same ROV footage used for visual documentation now also provides:
- Quantitative fouling metrics for maintenance decision-making
- Hull roughness estimate for performance monitoring
- Baseline data for tracking fouling progression between cleanings
- Objective measurements for evaluating coating performance
Rather than relying on subjective assessments like “light,” “moderate,” or “heavy” fouling, operators gain specific measurements: median barnacle diameter, coverage percentage, and estimated roughness values that can feed directly into performance models.
Scalable for Large Vessels
This approach scales naturally to large-scale hull inspections. The combination of HullSight Ultimate’s automated biofouling analysis and the Sentinus 2’s efficient inspection capabilities enables comprehensive hull surveys on vessels of all sizes. As demonstrated in our recent case study with Blue Atlas Robotics, the workflow handles thousands of inspection frames, providing complete hull coverage with consistent measurement quality.
Looking Forward
As the maritime industry focuses increasingly on efficiency and emissions reduction, understanding the true condition of hull surfaces becomes more valuable. The ability to quantify biofouling during routine inspections—without specialized equipment or procedures—makes this data accessible as part of normal operations.
The combination of ROV technology, stereo vision, and automated analysis transforms inspection from documentation into measurement, giving operators the information they need to optimize maintenance timing and predict performance impacts with greater confidence.

About the Partnership
This work represents a collaboration between Atlantic Tech & Candy and Blue Atlas Robotics, combining expertise in marine efficiency analysis with advanced ROV capabilities. The Sentinus 2 ROV’s stereo camera system provides the foundation for these measurements during standard underwater inspections.
Want to learn more about Hull Roughness Estimation? Contact Us!
