27 Jan Streamlining Large-Scale Hull Inspections: A Case Study with Blue Atlas Robotics
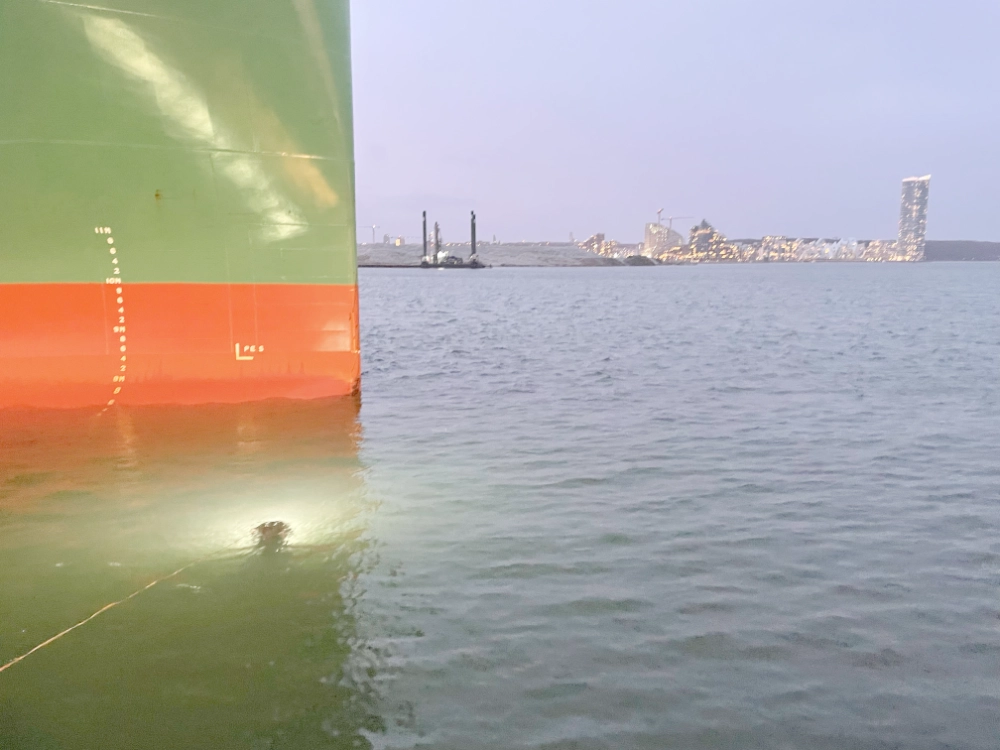
In December 2025, we successfully demonstrated the power of combining advanced robotics with AI-driven analysis during a large-scale hull inspection in Aarhus, Denmark. In partnership with Blue Atlas Robotics (BAR), we inspected a 200m container vessel, proving that comprehensive biofouling assessments can be both rapid and highly detailed.
The Inspection: Precision at Speed
The physical inspection was carried out by BAR using their Sentinus ROV. Known for its efficiency, the Sentinus covered almost the entire port and starboard sides of the vessel—scanning 49 distinct hull sections and niche areas—in just about 4 hours.
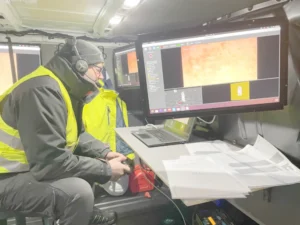
The Analysis: Powered by HullVAR
With the physical scan complete, the focus shifted to data analysis using HullVAR. We processed 5.5 GB of video material, consisting of individual video files for each of the 49 sections.
The speed of the workflow was unprecedented. From the start of the video upload to the delivery of the final report, the entire process took approximately 1 hour.
During this short window, HullVAR
- Automatically processed the video footage.
- Extracted roughly 850 representative images.
- Analyzed every image using our advanced biofouling AI model.
- Compiled the results into a comprehensive 54-page PDF report.
Actionable Results
The generated report delivered immediate, actionable insights into the vessel’s condition through a comprehensive overview of all inspected hull sections with their corresponding biofouling ratings. HullVAR’s flexible biofouling scales can be fully customized by customers to align with specific reporting requirements and industry standards, ensuring the analysis meets both internal quality protocols and external regulatory expectations.
This tailored approach provides vessel operators with precise, relevant data that supports informed maintenance decisions and compliance reporting.


The report provides comprehensive high-level statistics for each vessel side, delivering detailed overviews that include precise biofouling percentages, total count of analyzed images, and calculated overall biofouling ratings based on the selected assessment scale.
This side-by-side analysis enables quick comparative assessment between port and starboard surfaces, helping vessel operators identify patterns, prioritize maintenance areas, and track fouling distribution across the entire hull.
Each inspected hull section received comprehensive documentation with detailed statistical analysis—including fouling percentages, median values, minimum/maximum ranges, total analyzed images, and overall biofouling ratings—paired with carefully selected sample images that provide vessel operators with a clear, verifiable picture of the hull’s condition.
The three representative images strategically showcase areas of maximum, average, and minimum fouling, delivering immediate visual insight into fouling distribution patterns and helping operators quickly determine whether marine growth is uniformly distributed or concentrated in specific zones requiring targeted attention.

Conclusion
This operation in Aarhus highlights the synergy between Blue Atlas Robotics’ hardware and HullVAR’s software. Together, we delivered a complete, high-fidelity inspection of a 200m vessel with minimal downtime, turning gigabytes of raw video into a finalized, actionable report in record time.
Interested in a Large Scale Hull Inspection? Contact Us!
